Funnel Cakes, Carnival Rides, and Municipal Bonds
The market volatility following “Liberation Day” drove municipal yields to levels not seen since the Global Financial Crisis, presenting real opportunities for investors.

Key takeaways
- Nicholos Venditti, head of Municipal Fixed Income, explains the opportunities that recent roller-coaster-like market volatility has provided for municipal bond investors.
- In previous periods when U.S. municipal bonds experienced 3% or larger weekly price declines, they were met with a rapid increase in yields available to investors.
Funnel cakes. Also, nachos. And, to be honest, how do you pass up the soft-serve ice cream? As a 10-year-old, I lived for the Colorado State Fair and all the treats that filled the boardwalk. That summer, though, I had a different mission: Conquer The Ring of Fire. The upside-down roller-coaster that terrified and captivated me for as long as I could remember.
The outcome? Less triumphant. Most of the carnival food made a dramatic and unfortunate exit (details best left to the imagination). Like any 10-year-old, I rallied quickly. I didn’t view the experience as a disaster, but as an opportunity to replenish what I lost with another funnel cake. This time with extra powdered sugar.
The Ring of Fire was the wildest ride I’d experienced—until “Liberation Day” on April 2 sent fixed income markets into a tailspin.
The market volatility drove municipal yields to levels we haven’t seen since the Global Financial Crisis. Just like a heavily sugared funnel cake after a terrifying roller-coaster, yields at these levels present real opportunities for investors. The chart below shows four previous entry points into the municipal market with roughly comparable yields to the current market’s. The table following the chart shows the subsequent five-year annualized returns following each of those entry points.
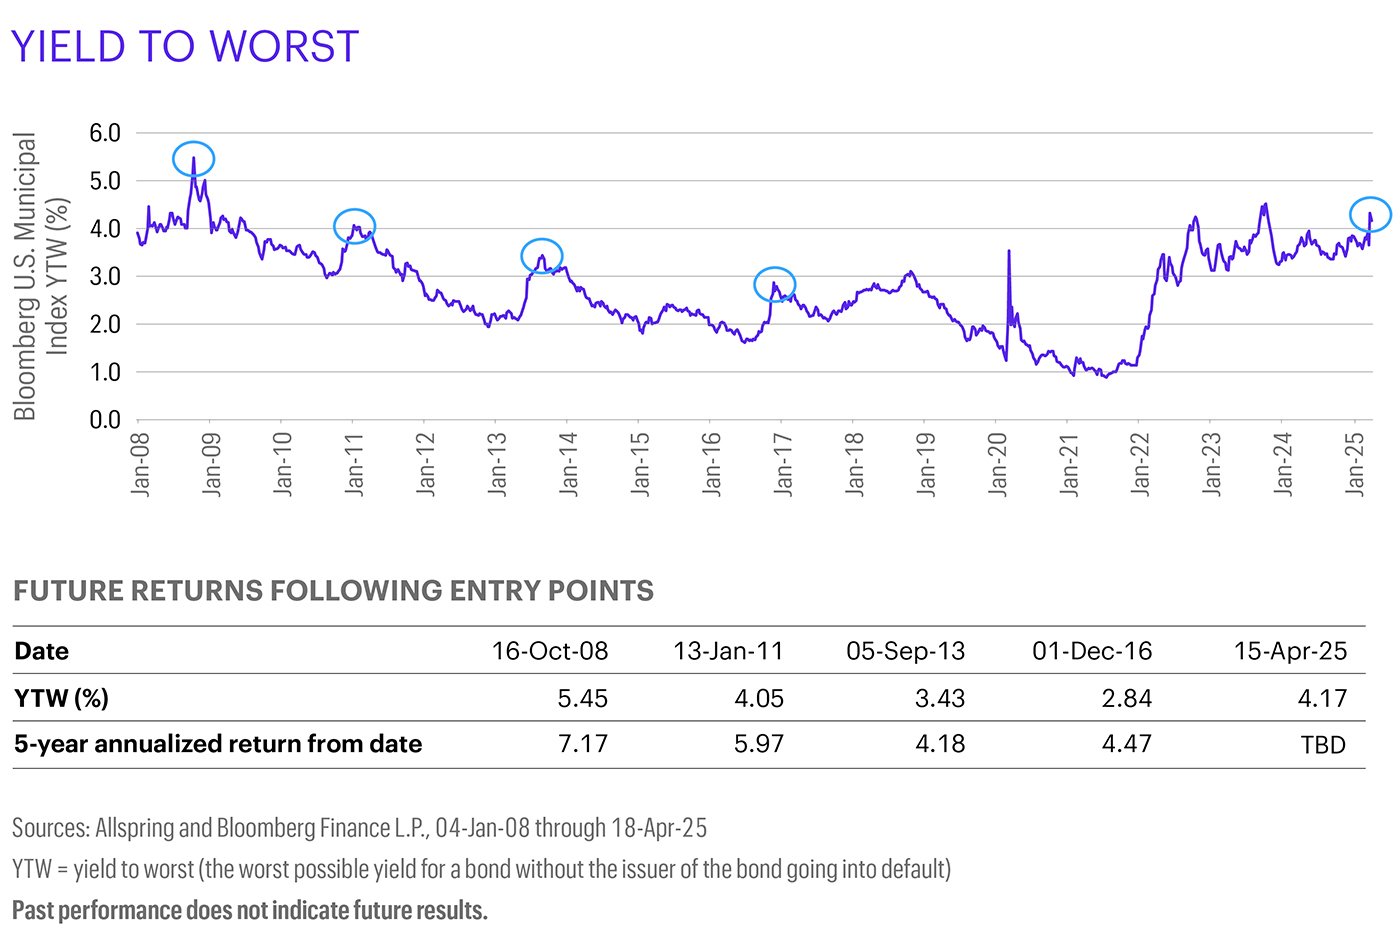
These compelling returns are even more so when you recognize they’re not adjusted for the tax benefit that municipal bonds can provide. For investors in the upper tax brackets, the potential to flirt with equity-like returns for muni-like risks is a possibility.
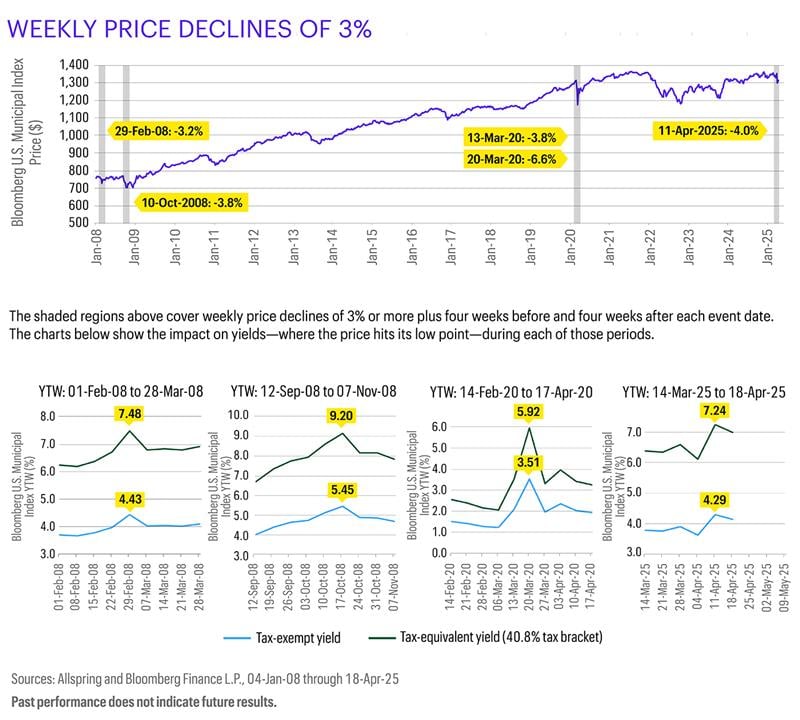
Opportunities like this don’t come around often. The chart below takes a historical look at periods when the Bloomberg Municipal Bond Index experienced a 3% or larger weekly decline. The corresponding price declines were met with a rapid increase in yields available to investors. Those yields (currently 4.29%, or a tax-adjusted 7.24% based on a 40.8% tax bracket) could potentially create a very interesting forward-looking return profile.
If there were ever a time for more funnel cake—oops, I mean municipal bonds—that time may be now.
ALL-04232025-yl35dc29
Related insights

Nick Venditti, head of Municipal Fixed Income at Allspring Global Investments, talks about how, for the first time in a while, the higher education sector is starting to show signs of distress.
Allspring fixed income experts George Bory and Nick Venditti recap an eventful start to the year. Trump took office again, wildfires raged in California, and the backdrop was set for a potentially volatile rest of the year. In this episode, find out what all that means for munis in 2025.

Allspring's Plus Fixed Income team explains the three key elements they believe may lead to a more balanced and enhanced return profile.

Allspring's Plus Fixed Income team explains why they believe now is the time to utilise an unconstrained multi-sector approach to uncover opportunities in global fixed income.

Insight
Bonds Be Nimble, Bonds Be QuickTwo of Allspring’s fixed income teams provide examples of how they have exploited pricing inefficiencies through thorough credit research and careful portfolio management.
Joseph Dore, Allspring’s head of International Consultant Relations, goes around the globe with senior portfolio managers Sarah Harrison and Noah Wise from the Plus Fixed Income team, talking about why now is an exciting time to be a global multi-sector fixed income investor.

George Bory discusses the intersection of politics and finance, the impact of previous U.S. election results on U.S. and global bonds, and the importance of economic fundamentals in post-election fixed income outcomes.
From Allspring's Global Fixed Income team, Alex Temple, Head of Credit, and Lauren van Biljon, Head of Rates and FX, join Matt Soifer, Head of US institutional distribution, to go around the globe—discussing how recent and upcoming elections from Asia, Europe, North America, and more may impact bond markets worldwide.

We discuss the current macro environment for bonds and how different types of investors can approach today’s bond market.
Podcast
Still T-bill and Chill?Jeff Weaver, CFA, head of Allspring’s Global Liquidity Solutions team, and George Bory, CFA, chief investment strategist for Allspring Fixed Income, discuss recent Fed (U.S. Federal Reserve) activity, new money fund liquidity requirements, and allocating investments at the front end of the curve.

Amidst a backdrop of diverging growth and inflation trends driving central bank policy, three strategies for global investors remain as relevant today as they were in the beginning of the year.