Macro Matters: Could Rates Stay Higher for Longer?
Macro Matters provides a concise, comprehensive look at macroeconomic themes that matter to clients.
Download PDF
Key takeaways
- U.S. growth has experienced some slowing but has remained robust, and global growth momentum has improved.
- U.S. inflation data indicate that lowering inflation from 3.0% to 2.0% will take time. Outside the U.S., the inflation situation continues to improve.
- With the strong U.S. economy and labor market, could the Federal Reserve (Fed) decide on fewer than three cuts this year? In Europe, a cut by June seems probable.
Growth: Some slowing in the U.S. while global growth momentum shows improvement
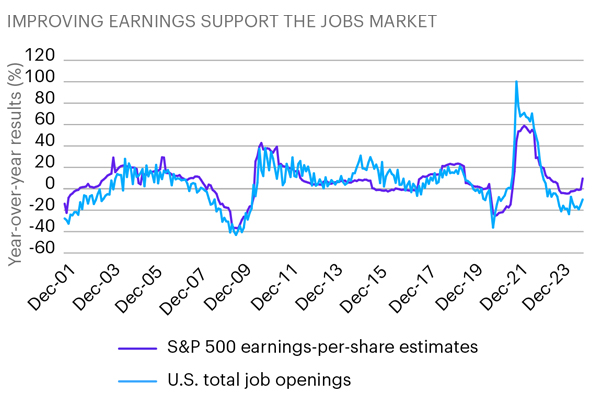
Despite weaker U.S. manufacturing and retail sales data and downward revisions to previous employment numbers, U.S. growth remained positive in the first quarter of 2024—lower than in the fourth quarter of 2023 but still robust. Inflation’s decline has moved real wages (wages after factoring in inflation) positive, and company earnings are expected to accelerate this year—both of which support the demand for labor.
Outside the U.S., growth is relatively weak in China and Europe, although forward-looking indicators show potential improvement in manufacturing and services. With both France and Germany slowing, though, Europe has been struggling. Germany is probably in recession already. A more ambitious rate-cutting policy by the European Central Bank (ECB) and the Bank of England (BoE) later this year will likely support international growth.
Inflation: The path from 3.0% to 2.0% will be much harder than from 9.0% to 3.0%
The Fed’s preferred inflation measure—the Personal Consumption Expenditures Price Index—has drifted lower. The markets largely viewed the latest U.S. inflation readings as positive. Despite a tick up in both core and headline inflation, the underlying data showed some positive signs. While core goods deflation halted due to higher used car prices, the share of categories signaling outright deflation increased. This aligned with our inflation breadth indicator, which continues to indicate moderation in prices. The last step toward 2.0% inflation will be harder for the Fed to achieve and will likely require some cooling in the labor market.
Internationally, inflation in Europe’s core consumer prices has declined to 3.1% and headline inflation has fallen to 2.6%. The ECB closely watches wage growth, which has moderated to 4.6%. While this remains above the ECB’s 3% target on wages, June’s quarterly wage report will likely show a level below 4.0%. China’s inflation has risen lately due largely to the short-term impact of the Lunar New Year holiday, and deflation is expected to resume given weak growth and a slowing property market.
Rates: Central bank cuts—it’s all about timing
March’s Fed meeting confirmed the expectation of three rate cuts in 2024 but fewer cuts predicted for 2025 and beyond. Also, the Fed’s long-term neutral interest rate, which promotes growth with little inflation, was upgraded slightly to 2.6%. With the U.S. economy humming along and the labor market supported by strong demand, the three rate cuts projected for this year seem more precautionary than necessary.
Internationally, the Swiss National Bank has already delivered a surprise cut, and the ECB and BoE are sounding less hawkish. Given a much weaker growth trajectory relative to the U.S. in both Europe and the U.K., a rate cut by June seems probable and likely the start of a cutting cycle. The outliers remain Japan, which hiked this March for the first time since 2006, and China, which is expected to ease further.
Sources: Allspring and Bloomberg Finance L.P. as of December 2023
The S&P 500 Index consists of 500 stocks chosen for market size, liquidity, and industry group representation. It is a market-value-weighted index with each stock’s weight in the index proportionate to its market value. You cannot invest directly in an index.
Implications for fixed income
U.S. Treasury bonds are down more than 1% this year (as of March 25), due largely to the pare-back in rate cut expectations and strong economic data. As of the same date, higher-yielding bonds have fared better and are positive as high yield bond spreads have compressed further. We remain positive on interest rate risk medium term, and the yield pickup of higher-yielding bonds is looking more attractive as long as the U.S. economy avoids a recession and the job market remains resilient.
Implications for equities
There’s been quite a bit of change in equities leadership over the past month. While Japanese equities have been leading the pack, European equities have been catching up and are now ahead of U.S. equities (as of March 25). Better-than-expected international economic data—despite improving to lower levels than in the U.S.—have enabled European equities to catch up. It’s all about expectations. China remains the laggard, even after a recent rally caused by government intervention. Lower real yields, strengthening currencies, and more attractive valuations could improve international equity sentiment further. We believe focusing on quality and valuation is a prudent approach.
Implications for multi-asset
A global 60% equities/40% bond portfolio is up nearly 4% since the beginning of 2024 at the end of March. Strong equity results offset some bond underperformance, and diversification between equities and bonds remains strong. While we expect U.S. growth to gradually slow this year, inflation might remain sticky for a bit longer, possibly unnerving investors over the short term. The longer-term trend, though, looks favorable to us for both equities and bonds. In terms of valuations, bonds remain attractive—mainly in the medium-term maturities and where there’s an attractive yield pickup—and on the equity side, international and emerging markets screen positively. Momentum in bonds has slowed since the strong rally at the end of 2023 while equity momentum remains positive. We continue to expect further broadening of the equity market rally, and we might have just seen the start of that within international equities.
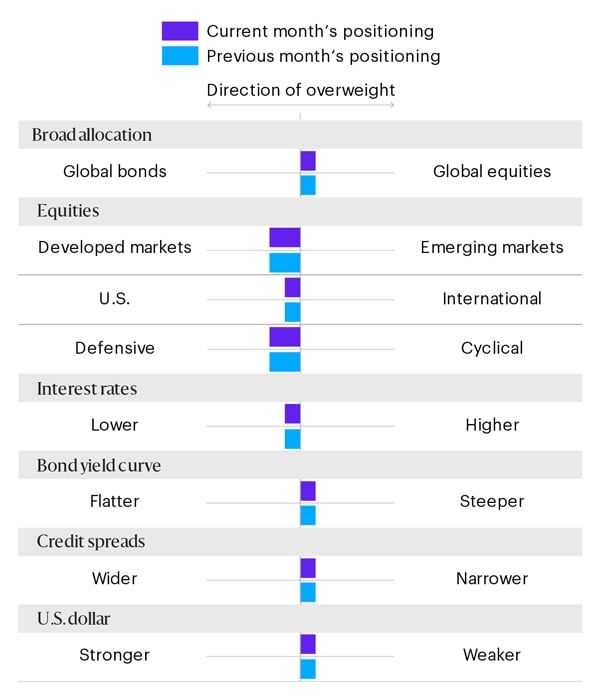
Potential allocations based on today’s environment
The table below depicts our views on short-term trends. These perspectives are developed using quantitative analysis of data over the past 30 years overlaid with qualitative analysis by Allspring investment professionals. The positioning of each bar in the table shows the direction and magnitude of an overweight.
For illustrative purposes only.
Source: Allspring Systematic Edge–Multi-Asset, based on the team’s analysis of current data and trends for each category of assets