DHICX

Strategic Municipal Bond Fund

$8.83
NAV

+$0.00 / +0.00%
1-day change
$1,915.5M
Fund assets
2.19%
30-day SEC yield*
1.82%
Year-to-date return
Data as of 12/27/2024
*As of 12/26/2024
Fund overview
Exploiting municipal market inefficiencies
The Strategic Municipal Bond Fund seeks tax-free income by principally investing in a diversified portfolio of municipal securities.

A relative value approach is conducted by actively managing the four key elements of total return: security selection, sector rotation, duration management, and yield curve positioning.
 
Key differentiators

  • Leverages a large, seasoned team of municipal fixed income analysts that’s supported by compliance and portfolio analytics systems
  • Collaborates across asset classes, such as using taxable fixed income analysts to gain intelligence on corporate bonds
  • May exercise the willingness and ability to move down in credit without compromising the investment process

General facts

Effective duration

3.76

(as of 11/30/2024)

Effective maturity

6.65

(as of 11/30/2024)

Distribution yield

1.73%

(as of 12/27/2024)

Benchmark name

Bloomberg Short-Intermediate Municipal Bond Index

Morningstar category

Muni National Short

Lipper category

Short-Intmdt Municipal Debt Funds

Ticker

DHICX

CUSIP

94985D756

Fund number

4503

Gross expense ratio

1.54%

(as of 11/1/2024)

Net expense ratio

1.54%

(as of 11/1/2024)

Fund inception date

3/21/1985

Quick resources

Morningstar Rating™

Out of 207 funds, Muni National Short As of 11/30/2024


An investment’s Overall Morningstar Rating™, based on its risk-adjusted return, is a weighted average of its applicable 3-, 5-, and 10-year Ratings.

Performance

Average annual returns

Average annual returns

(as of 11/30/2024)
3/21/1985
1M
3M
YTD
1Y
3Y
5Y
10Y
Inception
Fund
NAV POP
0.83
0.67
2.73
4.16
-0.07
0.50
1.15
-
LoadApplied
-0.17
-0.33
1.73
3.16
-0.07
0.50
1.15
-
Bloomberg Short-Intermediate Municipal Bond Index
0.86
0.49
1.85
3.37
0.52
1.22
1.76
-
Lipper Short-Intmdt Municipal Debt Funds
0.79
0.57
2.68
4.07
0.62
1.16
1.36
-
Expenses (as of 11/1/2024)
Gross Expense Ratio
1.54 %
Net Expense Ratio
1.54 %

One-month, three-month and year-to-date returns are not annualized.

Figures quoted represent past performance, which is no guarantee of future results, and do not reflect taxes that a shareholder may pay on an investment in a fund. Investment return, principal value, and yields of an investment will fluctuate so that an investor's shares, when redeemed, may be worth more or less than their original cost. Performance shown without sales charges would be lower if sales charges were reflected. Current performance may be lower or higher than the performance data quoted and assumes the reinvestment of dividends and capital gains. 

Public offering price (POP) is the price of one share of a fund including any sales charges. Net asset value (NAV) is the value of one share of the fund excluding any sales charges. Had sales charges been included, performance would be lower.

For Class C, the maximum front-end sales charge is 1.00%. Performance including sales charge assumes the sales charge for the corresponding time period. 

Calendar year

Calendar year

(as of 12/31/2023)
2023
2022
2021
2020
2019
2018
2017
2016
2015
2014
Fund
3.62
-6.20
0.15
2.36
3.73
1.26
2.37
-0.39
0.77
3.76
Benchmark
4.32
-4.51
0.43
3.97
5.23
1.69
3.03
-0.15
2.20
3.85
Morningstar
3.70
-2.64
0.22
2.28
3.12
1.18
1.69
-0.15
0.70
1.44
Growth of $10,000

Growth of a $10,000 investment

(as of 11/30/2024)

This chart shows the value of a hypothetical $10,000 investment in the fund over the specified time period up to 10 years or since its inception (for funds lacking 10-year records). The result is compared with benchmarks, which may include a broad-based market index and a peer group average or index. Market indexes do not include expenses, which are deducted from fund returns as well as mutual fund averages and indexes.

Does not include sales charges and assumes reinvestment of dividends and capital gains. If sales charges were included, returns would be lower.

Performance and volatility metrics

Performance and volatility metrics

(as of 11/30/2024)
3 Year 5 Year 10 Year
Alpha -0.54 -0.61 -4.99
Beta 0.88 0.92 0.85
Excess Return -0.60 -0.72 -0.77
Information Ratio -0.58 -0.71 -0.76
Sharpe Ratio -0.94 -0.51 -0.26
R2 0.96 0.94 0.91
Tracking Error 1.04 1.01 1.01
Standard Deviation 4.25 3.89 2.91
Upside Market Capture Ratio 81.26 85.56 71.03
Downside Market Capture Ratio 91.54 99.19 87.90
Morningstar ratings and rankings

Morningstar ratings and rankings

(as of 11/30/2024)
Overall
Muni National Short (Out of 207 funds)
Three Year
97th percentile (197 out of 207)
Five Year
95th percentile (184 out of 197)
Ten Year
76th percentile (110 out of 146)

The Overall Morningstar Rating for a fund is derived from a weighted-average of the performance figures associated with its three-, five- and ten-year (if applicable) ratings.

Morningstar rankings represent a fund's total return rank relative to all funds that have the same category. The percentile ranking is based on the fund's total return percentile rank relative to all funds that have the same category for the same time period. The highest (most favorable) percentile rank is 1% and the lowest (least favorable) percentile rank is 100%. Morningstar rankings do not include the effect of sales charges. The absolute ranking is based on the fund’s total return rank relative to all funds that have the same category for the same time period. Past performance is no guarantee of future results.
Prices, yields and distributions

Historical prices

YTD high $8.96 10/3/2024
YTD low $8.73 6/2/2024
52-week high $8.96 10/3/2024
52-week low $8.73 6/2/2024
2023 high $8.82 12/31/2023
2023 low $8.43 10/31/2023
Best quarterly return 4.19% 12/31/2023
Worst quarterly return -4.26% 3/31/2022
Best annual return 3.76% 12/31/2014
Worst annual return -6.20% 12/31/2022

Distribution summary

Dividends Monthly/Daily accrual
Capital gains Annually

Yields

Yield Statistic Date
Distribution yield 1.73% 12/27/2024
30-day SEC yield 2.19% 12/26/2024
30-day unsubsidized SEC yield 2.19% 12/26/2024
Yield to maturity 4.03% 11/30/2024
Yield to worst 3.87% 11/30/2024

Distribution history

Distribution history Type Per share amount Reinvestment price
2024-11-29 Dividend $0.01334504 $8.92
2024-11-28 Dividend $0.01334504 $8.92
2024-10-31 Dividend $0.012993588 $8.86
2024-09-30 Dividend $0.013361269 $8.95
2024-08-30 Dividend $0.013404889 $8.90
2024-07-31 Dividend $0.012475027 $8.85
2024-06-28 Dividend $0.012667701 $8.81
2024-05-31 Dividend $0.012106577 $8.73
2024-04-30 Dividend $0.012772234 $8.75
2024-03-28 Dividend $0.011620254 $8.81
2024-02-29 Dividend $0.012402744 $8.81
2024-01-31 Dividend $0.011236132 $8.81
2023-12-29 Dividend $0.011738776 $8.82
2023-11-30 Dividend $0.012355121 $8.71
2023-10-31 Dividend $0.011483247 $8.43
2023-09-29 Dividend $0.011745257 $8.50
2023-08-31 Dividend $0.01111621 $8.66
2023-07-31 Dividend $0.01059674 $8.71
2023-06-30 Dividend $0.01101368 $8.71
2023-05-31 Dividend $0.010126066 $8.66
2023-04-28 Dividend $0.010033887 $8.72
2023-03-31 Dividend $0.009451246 $8.74
2023-02-28 Dividend $0.010868303 $8.65
2023-01-31 Dividend $0.00876305 $8.78
2022-12-30 Dividend $0.009023759 $8.64
2022-11-30 Dividend $0.009030201 $8.64
2022-10-31 Dividend $0.008713374 $8.46
2022-09-30 Dividend $0.008229168 $8.51
2022-08-31 Dividend $0.007431458 $8.71
2022-07-29 Dividend $0.006718954 $8.83
2022-06-30 Dividend $0.007365803 $8.71
2022-05-31 Dividend $0.006806157 $8.79
2022-04-29 Dividend $0.006689286 $8.73
2022-03-31 Dividend $0.00475332 $8.89
2022-02-28 Dividend $0.006096195 $9.07
2022-01-31 Dividend $0.00330512 $9.13
2021-12-31 Dividend $0.00350807 $9.30
2021-11-30 Dividend $0.004213867 $9.31
2021-10-29 Dividend $0.003930537 $9.29
2021-09-30 Dividend $0.004346619 $9.32
2021-08-31 Dividend $0.00354135 $9.37
2021-07-30 Dividend $0.003762722 $9.39
2021-06-30 Dividend $0.004845973 $9.36
2021-05-28 Dividend $0.004396506 $9.35
2021-04-30 Dividend $0.004636439 $9.34
2021-03-31 Dividend $0.004837163 $9.31
2021-02-26 Dividend $0.006426451 $9.29
2021-01-29 Dividend $0.005679682 $9.38
2020-12-31 Dividend $0.005529221 $9.34
2020-11-30 Dividend $0.005821732 $9.31
2020-10-30 Dividend $0.005273548 $9.26
2020-09-30 Dividend $0.00645649 $9.28
2020-08-31 Dividend $0.006881436 $9.28
2020-07-31 Dividend $0.007334653 $9.29
2020-06-30 Dividend $0.007058282 $9.20
2020-05-29 Dividend $0.007870083 $9.12
2020-04-30 Dividend $0.00906009 $8.95
2020-03-31 Dividend $0.008677942 $9.03
2020-02-28 Dividend $0.008088872 $9.35
2020-01-31 Dividend $0.007328883 $9.29
2019-12-31 Dividend $0.007612819 $9.21
2019-12-10 Short-term capital gain $0.00737 $9.21
2019-11-29 Dividend $0.008054367 $9.21
2019-10-31 Dividend $0.007906391 $9.21
2019-09-30 Dividend $0.008474314 $9.21
2019-08-30 Dividend $0.008116989 $9.26
2019-07-31 Dividend $0.008351925 $9.21
2019-06-28 Dividend $0.009366315 $9.17
2019-05-31 Dividend $0.008831346 $9.16
2019-04-30 Dividend $0.009743259 $9.10
2019-03-29 Dividend $0.00948813 $9.10
2019-02-28 Dividend $0.011274025 $9.05
2019-01-31 Dividend $0.009235053 $9.03
2018-12-31 Dividend $0.009664853 $8.99
2018-11-30 Dividend $0.010130662 $8.93
2018-10-31 Dividend $0.009217097 $8.89
2018-09-28 Dividend $0.009059975 $8.93
2018-08-31 Dividend $0.00871349 $8.97
2018-07-31 Dividend $0.007416293 $8.97
2018-06-29 Dividend $0.007775548 $8.96
2018-05-31 Dividend $0.008056011 $8.96
2018-04-30 Dividend $0.008783528 $8.92
2018-03-29 Dividend $0.007466359 $8.94
2018-02-28 Dividend $0.008276265 $8.94
2018-01-31 Dividend $0.007463625 $8.95
2017-12-29 Dividend $0.006403911 $8.98
2017-12-13 Long-term capital gain $0.01141 $8.99
2017-12-13 Short-term capital gain $0.00977 $8.99
2017-11-30 Dividend $0.005572639 $8.99
2017-10-31 Dividend $0.005525167 $9.02
2017-09-29 Dividend $0.005883496 $9.02
2017-08-31 Dividend $0.005823192 $9.04
2017-07-31 Dividend $0.00611569 $9.00
2017-06-30 Dividend $0.006174572 $8.97
2017-05-31 Dividend $0.006837404 $8.99
2017-04-28 Dividend $0.007887562 $8.95
2017-03-31 Dividend $0.007145759 $8.92
2017-02-28 Dividend $0.0079273 $8.91
2017-01-31 Dividend $0.006800072 $8.89
2016-12-30 Dividend $0.00551295 $8.87
2016-12-09 Short-term capital gain $0.04514 $8.88
2016-11-30 Dividend $0.003547906 $8.91
2016-10-31 Dividend $0.003630034 $9.07
2016-09-30 Dividend $0.003878246 $9.09
2016-08-31 Dividend $0.002903255 $9.11
2016-07-29 Dividend $0.002757981 $9.10
2016-06-30 Dividend $0.004320574 $9.09
2016-05-31 Dividend $0.004745709 $9.06
2016-04-29 Dividend $0.003161236 $9.06
2016-03-31 Dividend $0.013426965 $9.02
2016-02-29 Dividend $0.006651731 $9.00
2016-01-29 Dividend $0.005730544 $9.03
2015-12-31 Dividend $0.005264294 $9.01
2015-12-11 Long-term capital gain $0.02086 $9.00
2015-12-11 Short-term capital gain $0.0028 $9.00
2015-11-30 Dividend $0.006196375 $9.01
2015-10-30 Dividend $0.006181428 $9.01
2015-09-30 Dividend $0.007270702 $8.98
2015-08-31 Dividend $0.005580231 $8.94
2015-07-31 Dividend $0.00490576 $8.95
2015-06-30 Dividend $0.004944589 $8.94
2015-05-29 Dividend $0.004053124 $8.95
2015-04-30 Dividend $0.003894967 $8.99
2015-03-31 Dividend $0.00248774 $9.01
2015-02-27 Dividend $0.003779474 $9.03
2015-01-30 Dividend $0.001094055 $9.06
2014-12-31 Dividend $0.001246101 $9.02
2014-12-11 Long-term capital gain $0.01505 $9.03
2014-12-11 Short-term capital gain $0.06196 $9.03
2014-11-28 Dividend $0.001717191 $9.10
2014-10-31 Dividend $0.00150924 $9.10
2014-09-30 Dividend $0.003157711 $9.09
2014-08-29 Dividend $0.00415423 $9.09
2014-07-31 Dividend $0.004444429 $9.05
2014-06-30 Dividend $0.00504073 $9.06
2014-05-30 Dividend $0.005737702 $9.07
2014-04-30 Dividend $0.007209064 $9.02
2014-03-31 Dividend $0.007916022 $8.98
2014-02-28 Dividend $0.010825506 $8.99
2014-01-31 Dividend $0.011199635 $8.92
2013-12-31 Dividend $0.011292565 $8.83
2013-12-09 Long-term capital gain $0.0331 $8.84
2013-12-09 Short-term capital gain $0.02162 $8.84
2013-11-29 Dividend $0.010704582 $8.89
2013-10-31 Dividend $0.009936368 $8.91
2013-09-30 Dividend $0.009454376 $8.87
2013-08-30 Dividend $0.007886898 $8.80
2013-07-31 Dividend $0.006604085 $8.88
2013-06-28 Dividend $0.004654318 $8.90
2013-05-31 Dividend $0.003568265 $9.00
2013-04-30 Dividend $0.004035009 $9.02
2013-03-28 Dividend $0.003853803 $9.01
2013-02-28 Dividend $0.005546529 $9.02
2013-01-31 Dividend $0.004835881 $9.01
2012-12-31 Dividend $0.005408589 $8.98
2012-12-07 Long-term capital gain $0.03863 $9.01
2012-12-07 Short-term capital gain $0.03937 $9.01
2012-11-30 Dividend $0.006048447 $9.09
2012-10-31 Dividend $0.006666417 $9.05
2012-09-28 Dividend $0.007215058 $9.03
2012-08-31 Dividend $0.00765201 $9.00
2012-07-31 Dividend $0.007677361 $8.99
2012-06-29 Dividend $0.007654998 $8.97
2012-05-31 Dividend $0.008042442 $8.97
2012-04-30 Dividend $0.008719237 $8.96
2012-03-30 Dividend $0.008314658 $8.94
2012-02-29 Dividend $0.009346308 $8.95
2012-01-31 Dividend $0.011060106 $8.91
2011-12-30 Dividend $0.013996325 $8.84
2011-12-09 Long-term capital gain $0.0047 $8.81
2011-12-09 Short-term capital gain $0.00329 $8.81
2011-11-30 Dividend $0.013941974 $8.81
2011-10-31 Dividend $0.014609889 $8.80
2011-09-30 Dividend $0.0154563 $8.83
2011-08-31 Dividend $0.01523267 $8.82
2011-07-29 Dividend $0.017441339 $8.81
2011-06-30 Dividend $0.017279659 $8.80
2011-05-31 Dividend $0.01841533 $8.78
2011-04-29 Dividend $0.018800018 $8.74
2011-03-31 Dividend $0.01909816 $8.71
2011-02-28 Dividend $0.019533458 $8.70
2011-01-31 Dividend $0.018188249 $8.67
2010-12-31 Dividend $0.017242514 $8.68
2010-11-30 Dividend $0.016634817 $8.71
2010-10-29 Dividend $0.015321559 $8.75
2010-09-30 Dividend $0.015206187 $8.76
2010-08-31 Dividend $0.013038731 $8.76
2010-07-30 Dividend $0.016539968 $8.73
2010-06-30 Dividend $0.012246858 $8.72
2010-05-28 Dividend $0.012254695 $8.70
2010-04-30 Dividend $0.011865831 $8.70
2010-03-31 Dividend $0.012684369 $8.69
2010-02-26 Dividend $0.011850005 $8.72
2010-01-29 Dividend $0.012647403 $8.71
2009-12-31 Dividend $0.013565843 $8.71
2009-11-30 Dividend $0.015075544 $8.72
2009-10-30 Dividend $0.018179672 $8.70
2009-09-30 Dividend $0.018797139 $8.74
2009-08-31 Dividend $0.019713397 $8.67
2009-07-31 Dividend $0.020255288 $8.63
2009-06-30 Dividend $0.018874529 $8.60
2009-05-29 Dividend $0.019249267 $8.63
2009-04-30 Dividend $0.018789351 $8.59
2009-03-31 Dividend $0.019141155 $8.55
2009-02-27 Dividend $0.017208797 $8.56
2009-01-30 Dividend $0.021284661 $8.57
2008-12-31 Dividend $0.022107806 $8.42
2008-11-28 Dividend $0.02227529 $8.44
2008-10-31 Dividend $0.023868771 $8.43
2008-09-30 Dividend $0.022172894 $8.58
2008-08-29 Dividend $0.022496855 $8.72
2008-07-31 Dividend $0.021448201 $8.70
2008-06-30 Dividend $0.020456341 $8.72
2008-05-30 Dividend $0.022198383 $8.73
2008-04-30 Dividend $0.021456976 $8.73
2008-03-31 Dividend $0.021895493 $8.73
2008-02-29 Dividend $0.021266511 $8.69
2008-01-31 Dividend $0.023204303 $8.79
2007-12-31 Dividend $0.022850904 $8.78
2007-11-30 Dividend $0.022355672 $8.78
2007-10-31 Dividend $0.022873264 $8.78
2007-09-28 Dividend $0.02206077 $8.79
2007-08-31 Dividend $0.022100989 $8.77
2007-07-31 Dividend $0.021431972 $8.80
2007-06-29 Dividend $0.021733892 $8.80
2007-05-31 Dividend $0.023090629 $8.81
2007-04-30 Dividend $0.021654556 $8.82
2007-03-30 Dividend $0.021763826 $8.83
2007-02-28 Dividend $0.019314734 $8.83
2007-01-31 Dividend $0.020766646 $8.81
2006-12-29 Dividend $0.020064797 $8.82
2006-11-30 Dividend $0.01885079 $8.83
2006-10-31 Dividend $0.019241919 $8.82
2006-09-29 Dividend $0.018550322 $8.82
2006-08-31 Dividend $0.019037675 $8.81
2006-07-31 Dividend $0.018457232 $8.78
2006-06-30 Dividend $0.0177457 $8.77
2006-05-31 Dividend $0.018224782 $8.78
2006-04-28 Dividend $0.017081451 $8.77
2006-03-31 Dividend $0.016775656 $8.78
2006-02-28 Dividend $0.014955556 $8.79
2006-01-31 Dividend $0.016244744 $8.78
2005-12-30 Dividend $0.015607424 $8.79
2005-11-30 Dividend $0.01459512 $8.78
2005-10-31 Dividend $0.014116542 $8.77
2005-09-30 Dividend $0.013484515 $8.78
2005-08-31 Dividend $0.014439727 $8.79
2005-07-29 Dividend $0.015020282 $8.80
2005-06-30 Dividend $0.01692612 $8.80
2005-05-31 Dividend $0.016448498 $8.77
2005-04-29 Dividend $0.0156408 $8.76
2005-03-31 Dividend $0.014856087 $8.76
2005-02-28 Dividend $0.012708799 $8.78
2005-01-31 Dividend $0.014063149 $8.76
2004-12-31 Dividend $0.013861049 $8.75
2004-11-30 Dividend $0.013355152 $8.74
2004-10-29 Dividend $0.013675525 $8.75
2004-09-30 Dividend $0.012400106 $8.74
2004-08-31 Dividend $0.014202681 $8.73
2004-07-30 Dividend $0.015095487 $8.70
2004-06-30 Dividend $0.013685337 $8.68
2004-05-28 Dividend $0.013272781 $8.68
2004-04-30 Dividend $0.013068803 $8.72
2004-03-31 Dividend $0.013937099 $8.80
2004-02-27 Dividend $0.013661929 $8.83
2004-01-30 Dividend $0.0163188 $8.80
Download CSV

The 30-day SEC yield is calculated with a standardized formula mandated by the SEC. The formula is based on maximum offering price per share and includes the effect of any fee waivers. Without waivers, yields would be reduced. The 30-day unsubsidized SEC yield does not reflect waivers in effect. A fund’s actual distribution rate will differ from the SEC yield and any income distributions from the fund may be higher or lower than the SEC yield.

Composition

Portfolio statistics

Portfolio statistics

(as of 11/30/2024)
Fund Benchmark
Number of Holdings 888 28551
Effective Duration 3.76 3.66
Weighted Average Effective Maturity 6.65 Years 4.55 Years
AMT 12.00 -
Average Credit Rating A AA
Average Maturity 8.21 Years 5.98 Years
Credit Spread Duration 3.69 3.67

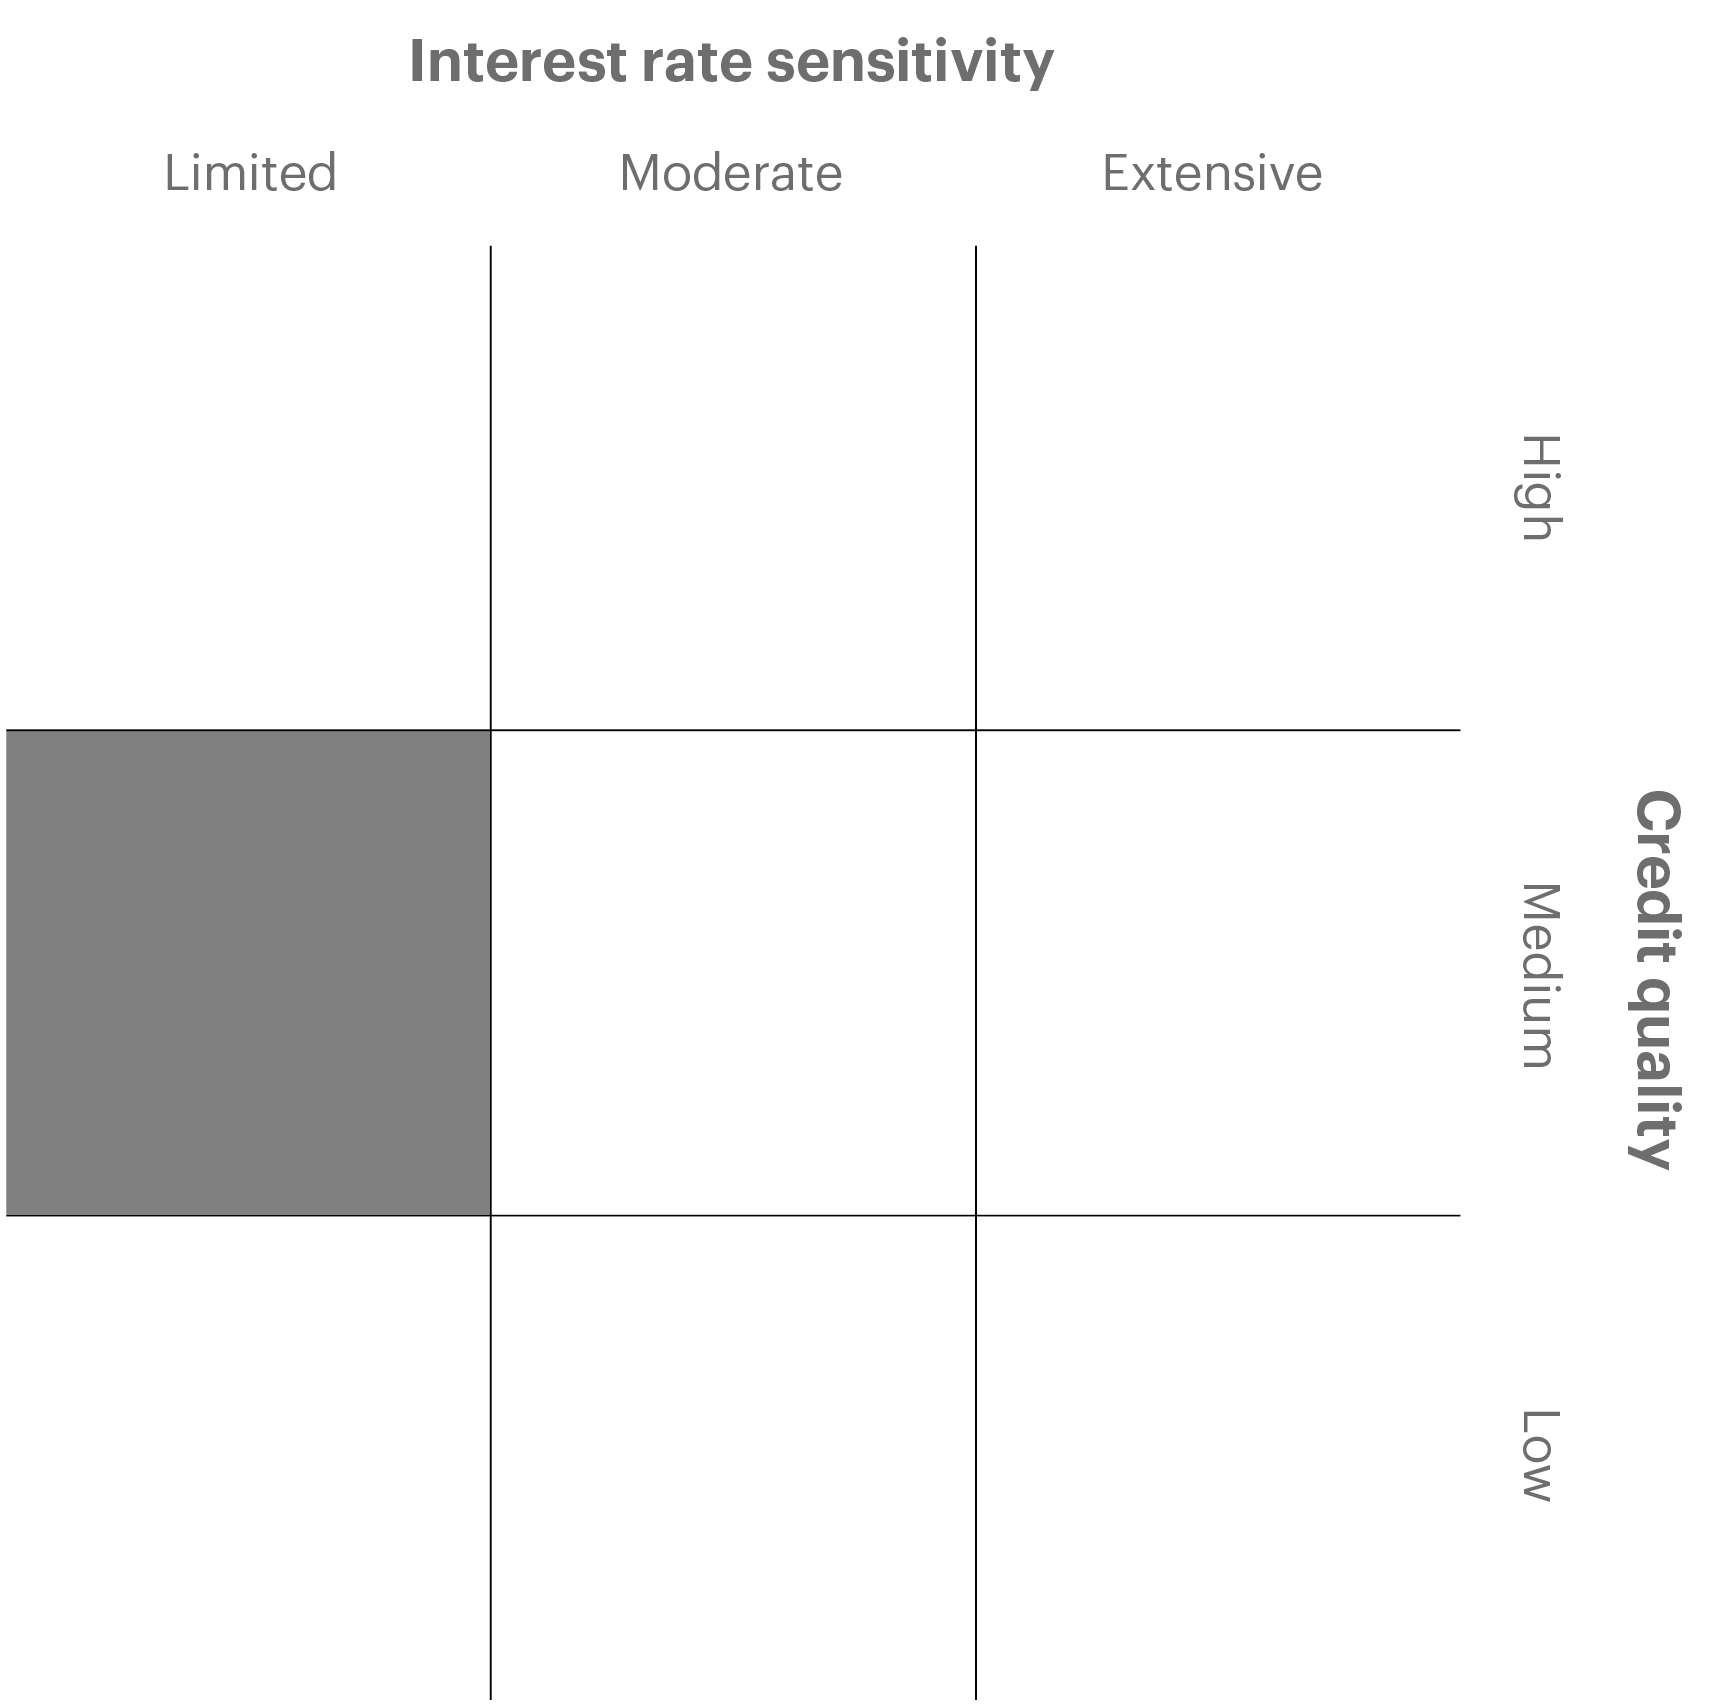
Fixed Income Style Box

(as of 11/30/2024) Overview chart

Placement within the Morningstar Equity Style Box is based on two variables: relative median market capitalization and relative price valuations (price/book and price/earnings) of the fund’s portfolio holdings. These numbers are drawn from the fund’s portfolio holdings figures most recently entered into Morningstar’s database and the corresponding market conditions. The Ownership Zone is represented by a shaded area surrounding the centroid. This zone encompasses 75% of a portfolio’s holdings on an asset-weighted basis and is designed to be a visual measure of how wide-ranging the portfolio is.

Credit quality

Credit quality

(as of 11/30/2024)
Type
Fund
Benchmark
AAA/Aaa
3.94% 16.95%
AA/Aa
28.98% 56.67%
A/A
29.89% 22.76%
BBB/Baa
20.39% 3.61%
BB/Ba
5.94% -
B/B
0.35% -
CCC/Caa and below
0.31% -
Not rated
9.54% 0.01%
Cash & equivalents
0.66% -

The ratings indicated are from Standard & Poor's, Fitch Ratings Ltd., and/or Moody's Investors Service. The percentages of the fund's portfolio with the ratings depicted in the chart are calculated based on total investments of the fund. If a security was rated by all three rating agencies, the middle rating was used. If rated by two of three rating agencies, the lower rating was used, and if rated by one of the agencies, that rating was used. Credit quality is subject to change and may have changed since the date specified. Percent total may not add to 100% due to rounding.

Maturity

Maturity

(as of 11/30/2024)
Maturity Range
Fund
0 - 1 year
22.10%
1 - 3 years
23.85%
3 - 5 years
18.66%
5 - 10 years
18.93%
10 - 20 years
13.25%
20+ years
3.20%

Maturity distribution is subject to change and may have changed since the date specified. Percent total may not add to 100% due to rounding.

Holdings

Top 10 holdings

(as of 11/30/2024)
Security
Fund
Main Str Nat Gas Inc Ga Gas Supply Rev
1.48%
City of Chicago (Illinois)
1.36%
Metropolitan Transn Auth N Y Rev
1.05%
Missouri St Health & Edl Facs Auth Health Facs Rev
1.01%
State of Connecticut
0.91%
City of Dallas (Texas)
0.88%
State of Michigan
0.87%
California Cmnty Choice Fing Auth Clean Energy Proj Rev
0.85%
Kentucky Inc Ky Pub Energy Auth Gas Suplly Rev
0.80%
Will County Community High School District No. 210 (Illinois)
0.76%
Top 10 represents 9.97% of total net assets
Portfolio composition

Portfolio composition

(as of 11/30/2024)
Credit Assets
Allocation
General obligation bonds
16.05%
Prerefunded bonds
0.10%
Revenue bonds
83.85%

Portfolio composition and maturity distribution are subject to change and may have changed since the date specified. Percent total may not add to 100% due to rounding

Documents

Literature Details Frequency
Fact Sheet A, C, Administrator, R6, Institutional Quarterly Download
Regulatory Document Details Date
Annual Long Form Financial Statements R6, Institutional, Administrator, C, A 6/30/2024 Download
Annual Report C 6/30/2024 Download
Full Prospectus A, C 11/1/2024 Download
Quarterly Holdings A, C, Administrator, R6, Institutional 9/30/2024 Download
Quarterly Holdings A, C, Administrator, R6, Institutional 3/31/2024 Download
Semi-annual Report A, C, Administrator, R6, Institutional 12/31/2023 Download
Statement of Additional Information A, C, Administrator, R6, Institutional 11/1/2024 Download
Summary Prospectus A, C 11/1/2024 Download
Our team
Meet the investment team

Investment success results from disciplined return-enhancement strategies balanced with prudent risk management.

Key risks

All investing involves risk, including the possible loss of principal. Bond values fluctuate in response to the financial condition of individual issuers, general market and economic conditions, and changes in interest rates. Changes in market conditions and government policies may lead to periods of heightened volatility in the bond market and reduced liquidity for certain bonds held by the fund. In general, when interest rates rise, bond values fall and investors may lose principal value. Interest rate changes and their impact on the fund and its share price can be sudden and unpredictable. Municipal securities risk includes the ability of the issuer to repay the obligation, the possibility of future tax and legislative changes and other factors, that may adversely impact the liquidity and value of the municipal securities in which the fund invests. A portion of the fund’s income may be subject to federal, state, and/or local income taxes or the alternative minimum tax. Any capital gains distributions may be taxable. Consult the fund’s prospectus for additional information on these and other risks.

Contact Us

We look forward to helping you with your investment needs


The Morningstar Rating™ for funds, or star rating, is calculated for managed products (including mutual funds, variable annuity and variable life subaccounts, exchange-traded funds, closed-end funds, and separate accounts) with at least a three-year history. Exchange-traded funds and open-ended mutual funds are considered a single population for comparative purposes. It is calculated based on a Morningstar risk-adjusted return measure that accounts for variation in a managed product’s monthly excess performance, placing more emphasis on downward variations and rewarding consistent performance. The Morningstar Rating does not include any adjustment for sales loads. The top 10% of products in each product category receive 5 stars, the next 22.5% receive 4 stars, the next 35% receive 3 stars, the next 22.5% receive 2 stars, and the bottom 10% receive 1 star. The Overall Morningstar Rating for a managed product is derived from a weighted average of the performance figures associated with its 3-, 5-, and 10-year (if applicable) Morningstar Rating metrics. The weights are: 100% 3-year rating for 36–59 months of total returns, 60% 5-year rating/40% 3-year rating for 60–119 months of total returns, and 50% 10-year rating/30% 5-year rating/20% 3-year rating for 120 or more months of total returns. While the 10-year overall star rating formula seems to give the most weight to the 10-year period, the most recent 3-year period actually has the greatest impact because it is included in all three rating periods. Past performance is no guarantee of future results.

Some of Morningstar’s proprietary calculations, including the Morningstar Rating™, are not customarily calculated based on adjusted historical returns. However, for new share classes/channels, Morningstar may calculate an extended-performance Morningstar Rating. The extended performance is calculated by adjusting the historical total returns of the oldest share class of a fund to reflect the fee structure of the younger share class/channel, attaching this data to the younger share class’s performance record, and then compounding the adjusted plus actual monthly returns into the extended-performance Morningstar risk-adjusted return for the 3-, 5-, and 10-year time periods. The Morningstar risk-adjusted returns are used to determine the extended-performance Morningstar Rating. The extended-performance Morningstar Rating for this fund does not affect the retail fund data published by Morningstar, as the bell curve distribution on which the ratings are based includes only funds with actual returns. The Overall Morningstar Rating for multi-share funds is based on actual performance only or extended performance only. Once the share class turns three years old, the Overall Morningstar Rating will be based on actual ratings only. The Overall Morningstar Rating for multi-share variable annuities is based on a weighted average of any ratings that are available.

While the inclusion of pre-inception data in the form of extended performance can provide valuable insight into the probable long-term behavior of newer share classes of a fund, investors should be aware that an adjusted historical return can provide only an approximation of that behavior. For example, the fee structures of a retail share class will vary from that of an institutional share class, as retail shares tend to have higher operating expenses and sales charges. These adjusted historical returns are not actual returns. The underlying investments in the share classes used to calculate the pre-performance string likely will vary from the underlying investments held in the fund after inception. Calculation methodologies used by Morningstar may differ from those applied by other entities, including the fund itself.

The manager has contractually committed to certain fee waivers and/or expense reimbursements. Without these reductions, the fund’s returns would have been lower and rankings may have been lower. These reductions may be discontinued.

© 2024 Morningstar. All rights reserved. The information contained herein is proprietary to Morningstar and/or its content providers; may not be copied or distributed; and is not warranted to be accurate, complete, or timely. Neither Morningstar nor its content providers are responsible for any damages or losses arising from any use of this information.


Performance for the fund or the class shown may reflect a predecessor fund's or class' performance and may be adjusted to reflect the fund's or class' expenses as applicable.